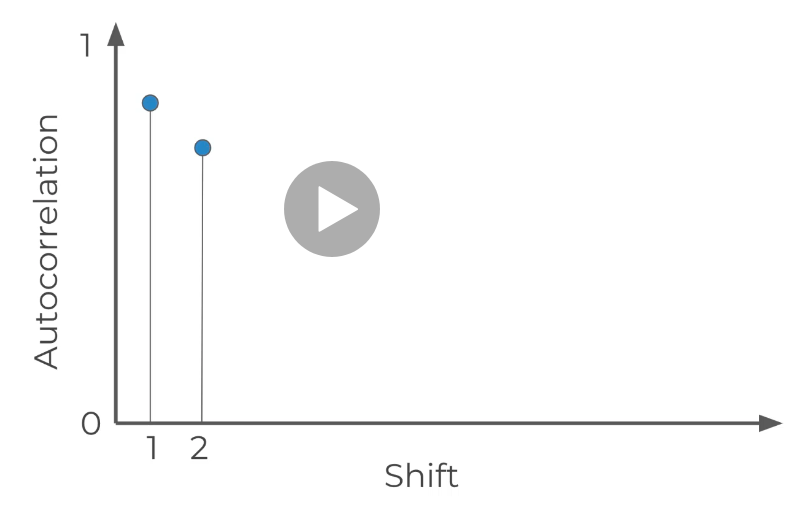
An autocorrelation plot (aka correlogram) shows the correlation of the series with itself, lagged by time units.
The axis is the correlation and axis is the number of time units of lag.
Example. If a time series containing the daily number of sales is given. The autocorrelation will answer the question: “How correlated are today’s sales to yesterday’s sales?”
Look at the correlation for 1 shift

Autocorrelation plot